Marketers are using 230% more data compared to 2020, yet 56% still struggle to find enough time to analyze it effectively (Supermetrics, 2025). More dashboards. More reports. More numbers. And somehow, less clarity than ever.
The problem isn’t that you lack data. It’s that you’re tracking too much of it.
With marketing budgets flatlined at 7.7% of overall company revenue in 2025 (Gartner, 2025) and 83% of marketing leaders citing ROI measurement as their top priority (Firework, 2025), choosing the right marketing metrics to track has never been more critical.
The solution isn’t tracking more metrics. It’s choosing the right ones.
This article gives you a practical 4-step framework for selecting the marketing metrics that actually drive decisions and prove ROI. You’ll also get a list of the 12 metrics that matter most, a channel-by-channel breakdown, and a system for building accurate tracking – starting with UTM parameters – from day one.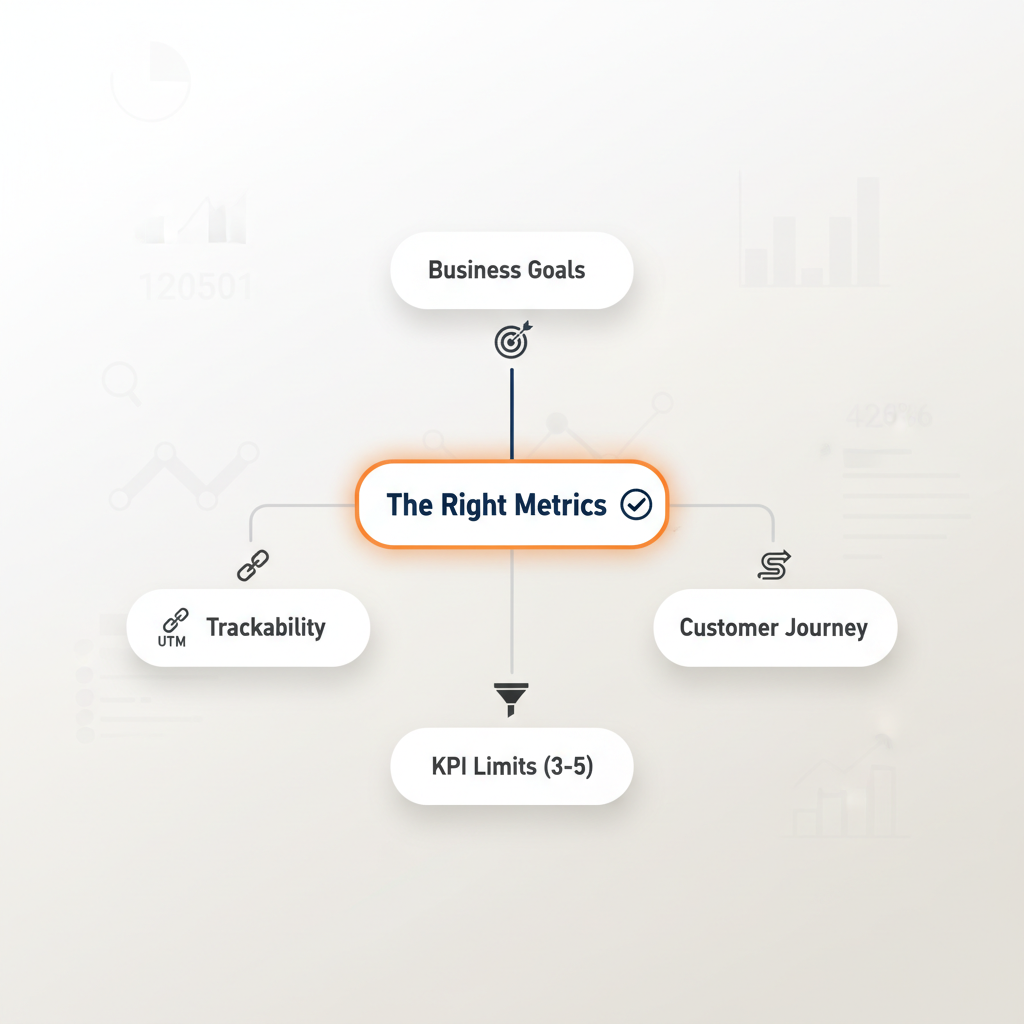
What Are Marketing Metrics?
Marketing metrics are quantifiable measures used to evaluate the performance and effectiveness of marketing activities. These marketing performance metrics include data points like conversion rate, click-through rate, and customer acquisition cost. Marketers use metrics to track progress toward goals, optimize campaigns, and justify marketing spend.
But not every metric deserves a spot on your dashboard. The distinction between a metric and a KPI is where most teams go wrong.
What Is the Difference Between a Marketing Metric and a KPI?
A Key Performance Indicator (KPI) is a metric directly tied to a strategic business goal. While all KPIs are metrics, not all metrics are KPIs. A metric becomes a KPI when it measures progress toward a specific outcome. “Website traffic” is a metric. “Organic traffic leading to demo signups” is a KPI.
| Aspect | Metric | KPI |
|---|---|---|
| Definition | Any quantifiable marketing data point | A metric tied to a strategic business goal |
| Scope | Broad — hundreds exist | Narrow — 3-5 per objective |
| Example | Page views, impressions, clicks | Revenue per channel, CAC, CLV |
| Purpose | Monitor activity | Drive decisions |
| Reporting | Supporting detail | Headline number |
Understanding this difference is the first step toward cleaning up your reporting. Most dashboard overload happens because teams treat every metric as a KPI.
Why Do Most Marketers Track the Wrong Metrics?
Only 36% of marketers say they can accurately measure ROI, and 34.2% of companies rarely or never measure the ROI of their marketing spend (Marketing Week, 2024). The metric overload problem is real, and it’s costing teams both time and budget.
What Are Vanity Metrics?
Vanity metrics are data points that look impressive on a dashboard but do not influence business decisions or predict revenue outcomes. Examples include raw page views, social media follower counts, and total impressions. The test for a vanity metric is simple: if the number went up or down by 20%, would you change your strategy? If not, it’s a vanity metric.
When teams are bombarded by 30+ metrics, they report feeling 38% less clear on what actually matters (CEO TXT, 2025). That’s the dashboard fatigue problem in action. More data doesn’t produce better decisions. The right data does.
| Aspect | Vanity Metrics | Actionable Metrics |
|---|---|---|
| Definition | Look impressive, don’t inform decisions | Directly inform strategy changes |
| Examples | Page views, followers, impressions | Conversion rate by source, CAC, CLV |
| The Test | “Would I change strategy if this moved 20%?” — No | “Would I change strategy if this moved 20%?” — Yes |
| Reporting Value | Background context | Dashboard headline |
| Business Connection | Indirect at best | Direct tie to revenue or growth |
If a metric doesn’t change your next decision, it shouldn’t be on your dashboard.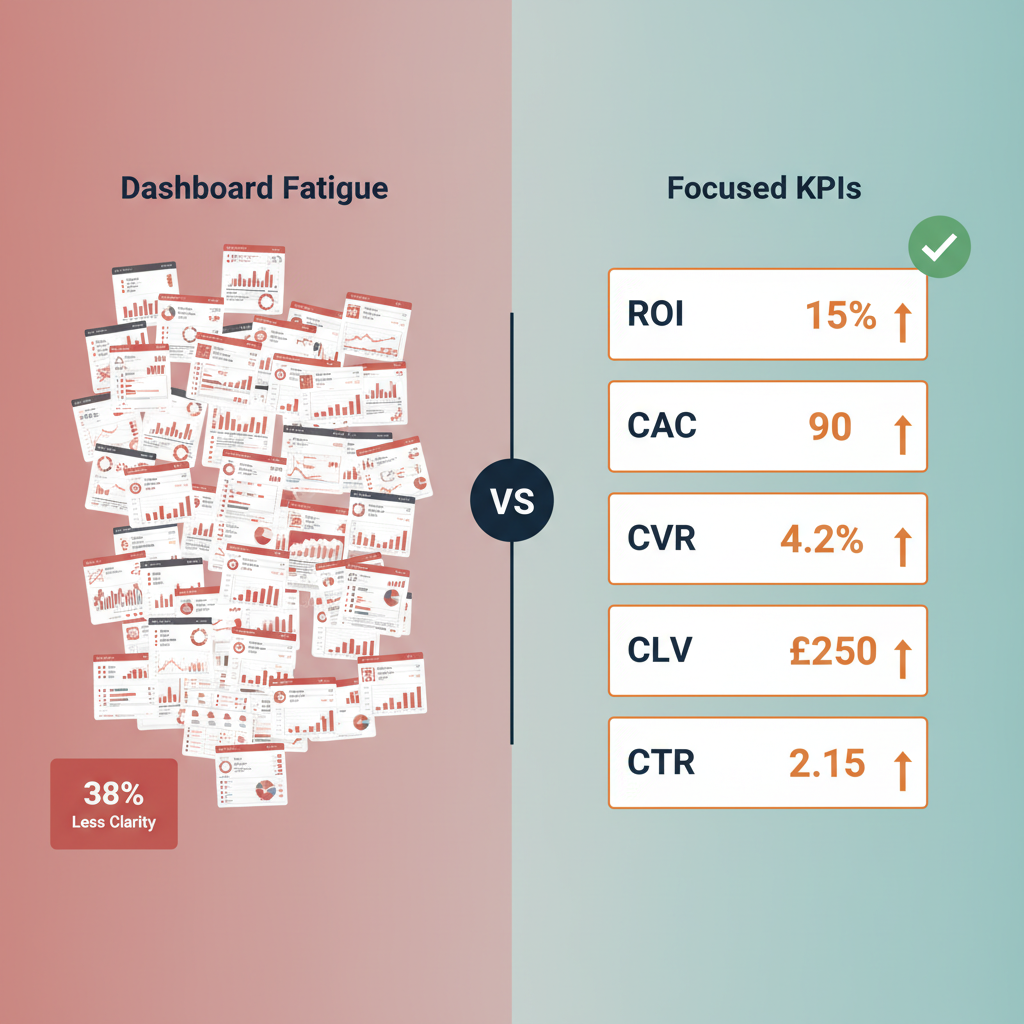
How Do You Choose the Right Marketing Metrics? The 4-Step Framework
Here’s the KPI framework that separates marketers who report on everything from marketers who report on what matters:
- Start with business goals, not marketing goals
- Map metrics to the customer journey
- Limit to 3-5 core KPIs per objective
- Ensure every metric is trackable and actionable
Let’s break each step down.
Step 1: How Do You Align Metrics to Business Goals?
Start by asking what the business needs marketing to improve, not what marketing wants to measure. Too many teams pick metrics based on what’s easy to track rather than what connects to revenue.
“Demonstrating the impact of marketing actions on financial outcomes” is the number one challenge for 64% of marketing leaders (The CMO Survey, Duke Fuqua, 2025). The disconnect between marketing metrics and business outcomes is the core of this challenge.
Align every metric to one of these business outcomes: revenue growth, cost reduction, customer retention, or market expansion. This is how you measure marketing effectiveness. If a metric doesn’t map to at least one, it’s a supporting detail, not a KPI.
Highly data-driven organizations are 3x more likely to report significant improvements in decision-making (PwC Survey via HBS Online, 2024). That improvement starts with measuring what matters to the business, not just to the marketing department.
Step 2: How Do You Map Metrics to the Customer Journey?
Once you know your business goals, map specific metrics to each stage of the customer journey. Different stages require different measurements.
| Customer Journey Stage | Primary Metrics | What They Measure |
|---|---|---|
| Awareness | Reach, impressions, brand search volume | How many people know you exist |
| Consideration | Engagement rate, time on page, email subscribers | How many people are evaluating you |
| Conversion | Conversion rate, CPL, CPA | How many people take action |
| Retention | CLV, churn rate, NPS | How many people stay and grow |
This mapping prevents the common mistake of tracking the wrong funnel metrics – measuring awareness metrics when your goal is conversion, or tracking conversion metrics when your real problem is awareness.
Only 32% of marketers globally measure their media spending holistically across both digital and traditional channels (Nielsen, 2025). Journey-stage mapping helps you see the full picture.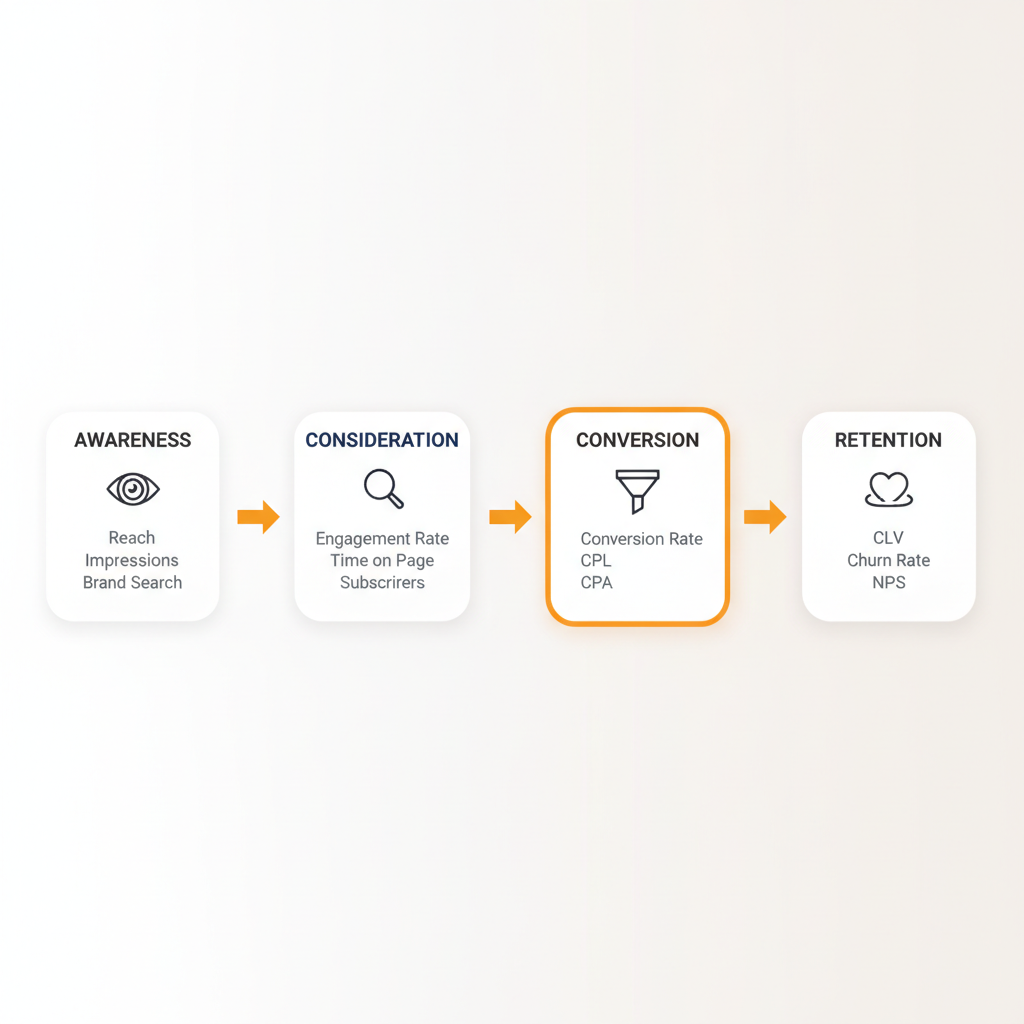
Step 3: How Many Marketing Metrics Should You Track?
Track 3-5 key marketing KPIs per business objective. Not 30. Not 15. Three to five.
When teams monitor more than 30 metrics simultaneously, reported clarity on priorities drops by 38% (CEO TXT, 2025). The “less is more” principle isn’t just advice. It’s backed by data.
Within those 3-5 KPIs, distinguish between leading and lagging indicators:
| Aspect | Leading Indicators | Lagging Indicators |
|---|---|---|
| Timing | Predictive (forward-looking) | Historical (backward-looking) |
| Action | Enable course correction | Confirm outcomes |
| Examples | CTR, email open rate, MQL volume, pipeline velocity | Revenue, CAC, churn rate, quarterly ROI |
| Speed | Change quickly | Change slowly |
| Use | Optimize in real time | Report to leadership |
The best dashboards include both. Leading indicators tell you what’s about to happen. Lagging indicators tell you what already happened. You need both to steer the ship.
Step 4: How Do You Ensure Metrics Are Trackable?
A metric is only useful if you can actually measure it accurately. Ask two questions about every metric on your list:
- Can you measure it? Do you have the tools, tags, and tracking infrastructure to capture this data reliably?
- Does it tell you what to do next? When this number moves, do you know what action to take?
If the answer to either question is no, the metric isn’t ready to be a KPI.
This is where campaign tracking becomes foundational. 47% of marketers struggle with multi-touch attribution, making it difficult to determine which channel or strategy drives the most ROI (Marketing LTB, 2025). Without clean tracking data, even the right metrics give you wrong answers.
UTM parameters solve this by tagging every marketing link with source, medium, and campaign data. They’re the foundation of accurate marketing measurement.
What Are the 12 Marketing Metrics That Actually Matter?
After applying the framework, these are the marketing metrics that matter – 12 metrics that consistently prove their value across industries and channels:
- Return on Investment (ROI)
- Customer Acquisition Cost (CAC)
- Marketing Efficiency Ratio (MER)
- Conversion Rate
- Cost Per Lead (CPL)
- Sales-Qualified Leads (SQLs)
- Customer Lifetime Value (CLV)
- Retention Rate / Churn Rate
- Net Promoter Score (NPS)
- Click-Through Rate (CTR)
- Engagement Rate
- Attribution Accuracy
Let’s break down each group.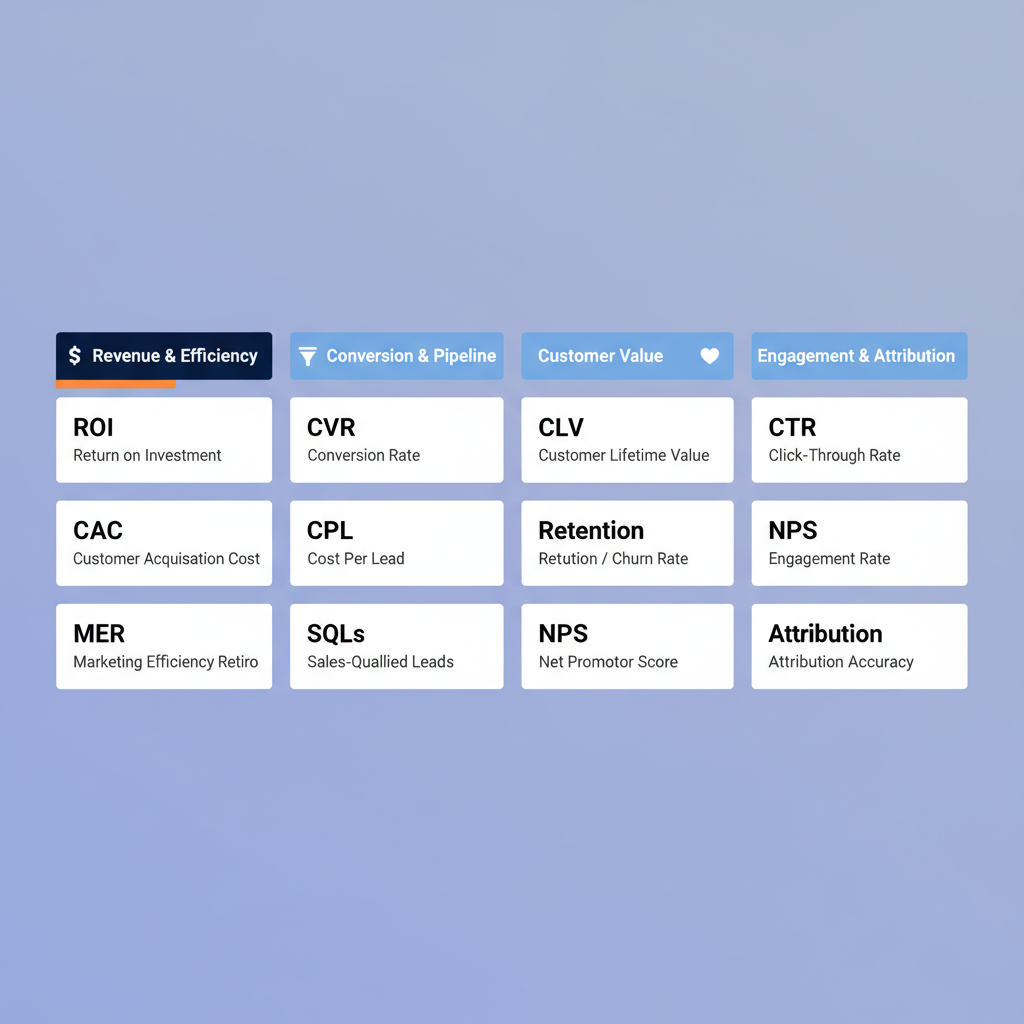
Revenue and Efficiency Metrics
Marketing ROI measures the return generated from marketing spend. The formula is straightforward: (Revenue from Marketing – Marketing Cost) / Marketing Cost. A 5:1 ratio is generally considered strong. If you’re spending $10,000 on marketing and generating $50,000 in attributable revenue, your ROI is solid. Track this metric to understand digital marketing ROI metrics that prove your marketing works.
Customer Acquisition Cost (CAC) is the total cost of acquiring one new customer: Total Marketing + Sales Spend / Number of New Customers Acquired. CAC tells you whether your growth is sustainable. If your CAC exceeds the revenue a customer generates, you’re losing money on every acquisition.
Marketing Efficiency Ratio (MER) is total revenue divided by total marketing spend. Unlike ROAS, which measures individual campaign returns, MER gives you a holistic view of marketing’s contribution to revenue. It’s the metric your CFO cares about most.
Conversion and Pipeline Metrics
Conversion Rate is the percentage of visitors who complete a desired action. The formula: (Conversions / Total Visitors) x 100. Benchmarks vary by channel and industry, but tracking conversion rate by source tells you which channels work hardest. You can calculate digital marketing ROI more accurately when conversion data is clean.
Cost Per Lead (CPL) measures how much you spend to generate one lead: Total Campaign Spend / Number of Leads. CPL varies significantly by channel. Paid search may have a higher CPL than organic content, but the leads may convert faster.
Sales-Qualified Leads (SQLs) bridge marketing and sales. An SQL is a lead that marketing has vetted and sales has accepted as ready for a conversation. This metric prevents the age-old “marketing sends bad leads” argument by creating a shared definition of quality.
Customer Value Metrics
Customer Lifetime Value (CLV) estimates the total revenue a customer generates over their entire relationship with your business. The basic formula: Average Purchase Value x Purchase Frequency x Customer Lifespan. A healthy CLV: CAC ratio is 3:1 or higher, meaning a customer generates at least three times what it cost to acquire them.
Retention Rate and Churn Rate are inverses of each other. Retention Rate = ((Customers at End – New Customers) / Customers at Start) x 100. Churn Rate = (Lost Customers / Total Customers at Start) x 100. A 5% improvement in retention can increase profits by 25-95%.
Net Promoter Score (NPS) measures customer sentiment by asking one question: “How likely are you to recommend us?” NPS is a leading indicator. High NPS predicts organic growth through referrals. Declining NPS warns of churn before it shows up in revenue numbers.
Engagement and Attribution Metrics
Click-Through Rate (CTR) measures how often people click your link, ad, or email relative to how many saw it: (Clicks / Impressions) x 100. CTR is the earliest signal in your funnel. Low CTR means your message isn’t resonating before anyone even reaches your site.
Engagement Rate is one of the most important user engagement metrics, measuring meaningful interactions beyond a passive view. Clicks, comments, shares, time on page, and scroll depth all count. The key distinction: meaningful engagement predicts conversion. Vanity engagement (likes without clicks) doesn’t.
Attribution Accuracy isn’t a traditional metric with a formula, but it’s arguably the most important one. Attribution accuracy measures the quality of your revenue attribution data. If your UTM parameters are inconsistent, your attribution is fragmented, and every other metric on this list becomes unreliable.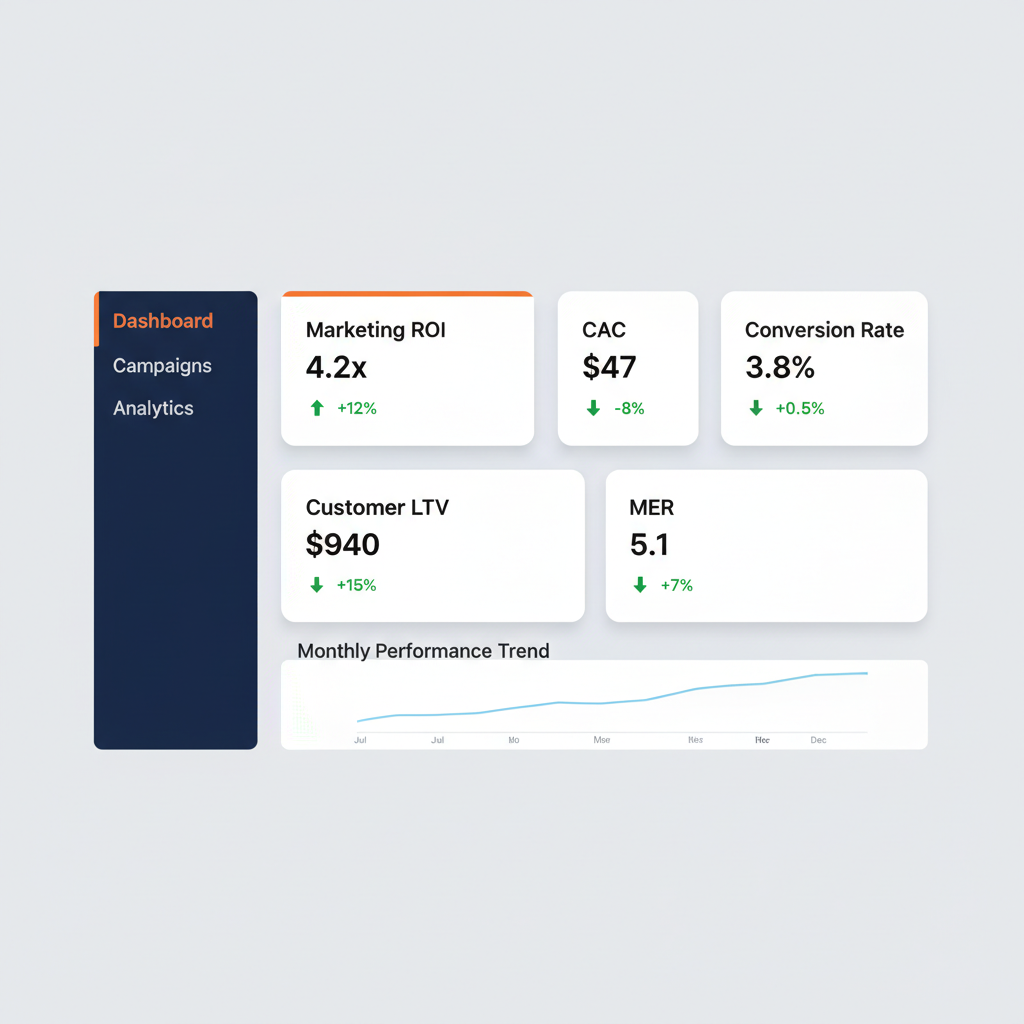
Which Marketing Metrics Matter Most by Channel?
Different marketing channels demand different primary metrics. Here’s a quick reference:
| Channel | Primary Metrics | Secondary Metrics |
|---|---|---|
| SEO | Organic revenue, conversion rate, CLV | Rankings, organic traffic, bounce rate |
| PPC / Paid Search | ROAS, CPA, conversion rate | CTR, quality score, impression share |
| Email Marketing | Revenue per email, CTR, conversion rate | Open rate, unsubscribe rate, list growth |
| Social Media | Engagement rate, CPA, attribution | Reach, impressions, follower growth |
| Content Marketing | CPL, CLV, time-to-convert | Traffic, dwell time, shares |
Notice the pattern: primary metrics connect to revenue. Secondary metrics provide context. Knowing which digital marketing KPIs to track across each channel prevents misallocated budget. Track primary metrics as KPIs. Use secondary metrics to diagnose why primary metrics move. For a practical example, see how to track email campaigns with UTM parameters to measure revenue per email and campaign conversion rates.
UTM best practices make cross-channel comparison possible by giving every link a consistent source, medium, and campaign tag. Without them, your channel data overlaps and fragments.
How Do You Build a Marketing Metric Tracking System?
Choosing the right metrics is half the battle. Building a system to track them accurately is the other half.
How Do You Set Up Consistent Campaign Tracking?
Start with UTM codes. Every marketing link you share should include UTM parameters that identify its source, medium, and campaign. This is the foundation of accurate measurement.
The biggest tracking mistake teams make is inconsistent naming. When one person tags a link as “Facebook” and another uses “facebook” or “fb,” your analytics platform treats them as three separate sources. That single inconsistency fragments your data across every report and metric you track.
Establish a naming convention before creating your first link. Use lowercase only. Replace spaces with hyphens or underscores. Document your conventions and organize your campaign links consistently across your team.
Marketers waste an estimated 21% of their marketing budgets because of bad data quality (Digital Commerce 360, 2024). Consistent campaign tracking prevents most of that waste.
What Tools Do You Need to Track Marketing Metrics?
At minimum, your analytics stack needs three layers:
- Google Analytics 4 for web analytics, event tracking, and conversion reporting
- A UTM link management platform like linkutm for consistent campaign tracking, branded short links, and enforced naming conventions – see available plans
- A marketing automation tool for lead journey data, email metrics, and CRM integration
The key requirement across all tools is consistent UTM parameter usage. If your tracking infrastructure is solid, every metric on your dashboard becomes trustworthy.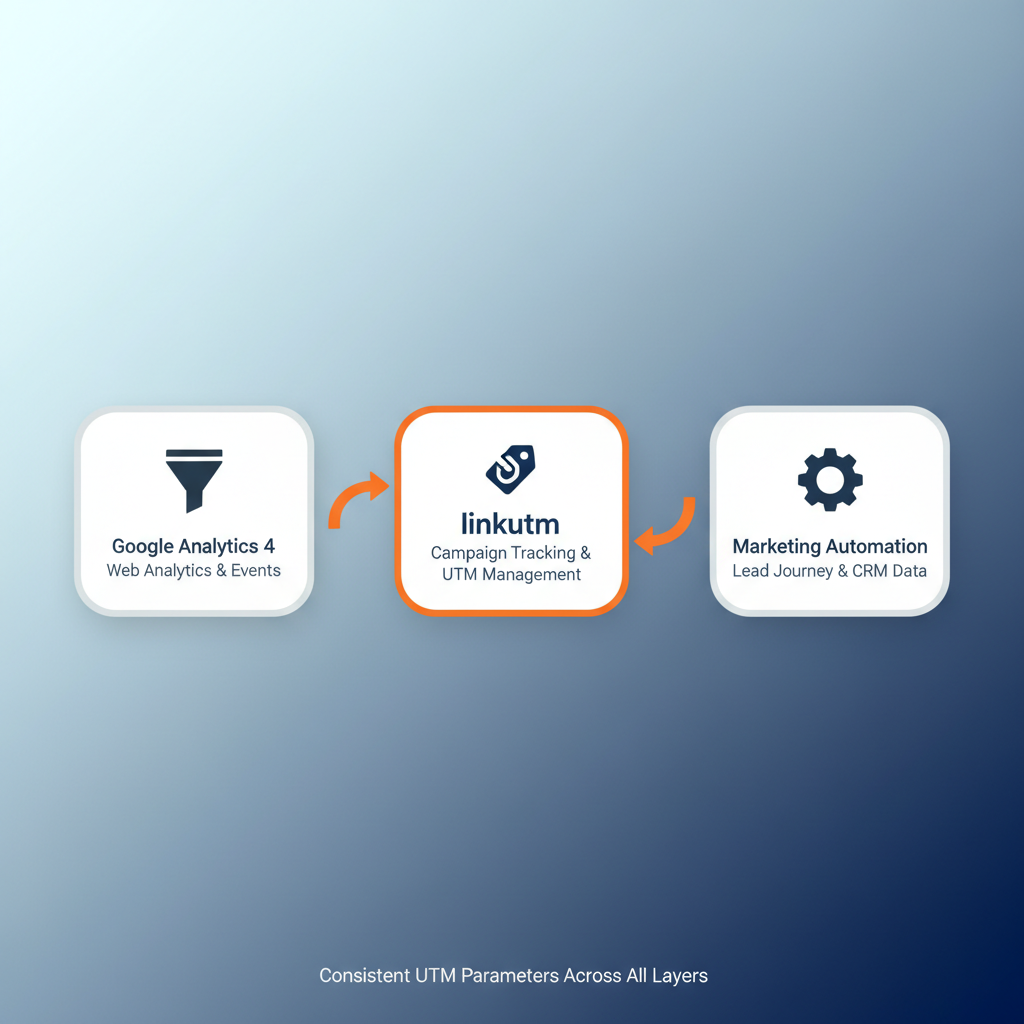
How Often Should You Review Marketing Metrics?
Not all metrics need the same review cadence. Match reporting frequency to metric type:
- Weekly: Campaign performance metrics like CTR, CPC, email open rates, and daily conversions. These let you optimize in real time.
- Monthly: Channel-level KPIs like conversion rate, CPL, MQL volume, and traffic trends. Monthly reviews reveal patterns weekly snapshots miss.
- Quarterly: Business-impact metrics like ROI, CAC, CLV, and MER. These need time to accumulate meaningful data.
| Cadence | Metric Type | Examples | Purpose |
|---|---|---|---|
| Weekly | Campaign performance | CTR, CPC, email open rate, daily conversions | Real-time optimization |
| Monthly | Channel-level KPIs | Conversion rate, CPL, MQL volume, traffic trends | Trend analysis |
| Quarterly | Business-impact metrics | ROI, CAC, CLV, MER, churn rate | Strategic reporting |
63% of marketers say the majority of their data-related time is spent on tasks that could be partially or fully automated, including manual reporting that consumes roughly 6 hours per week (Dataslayer, 2025). Automating your reporting cadence frees that time for actual analysis.
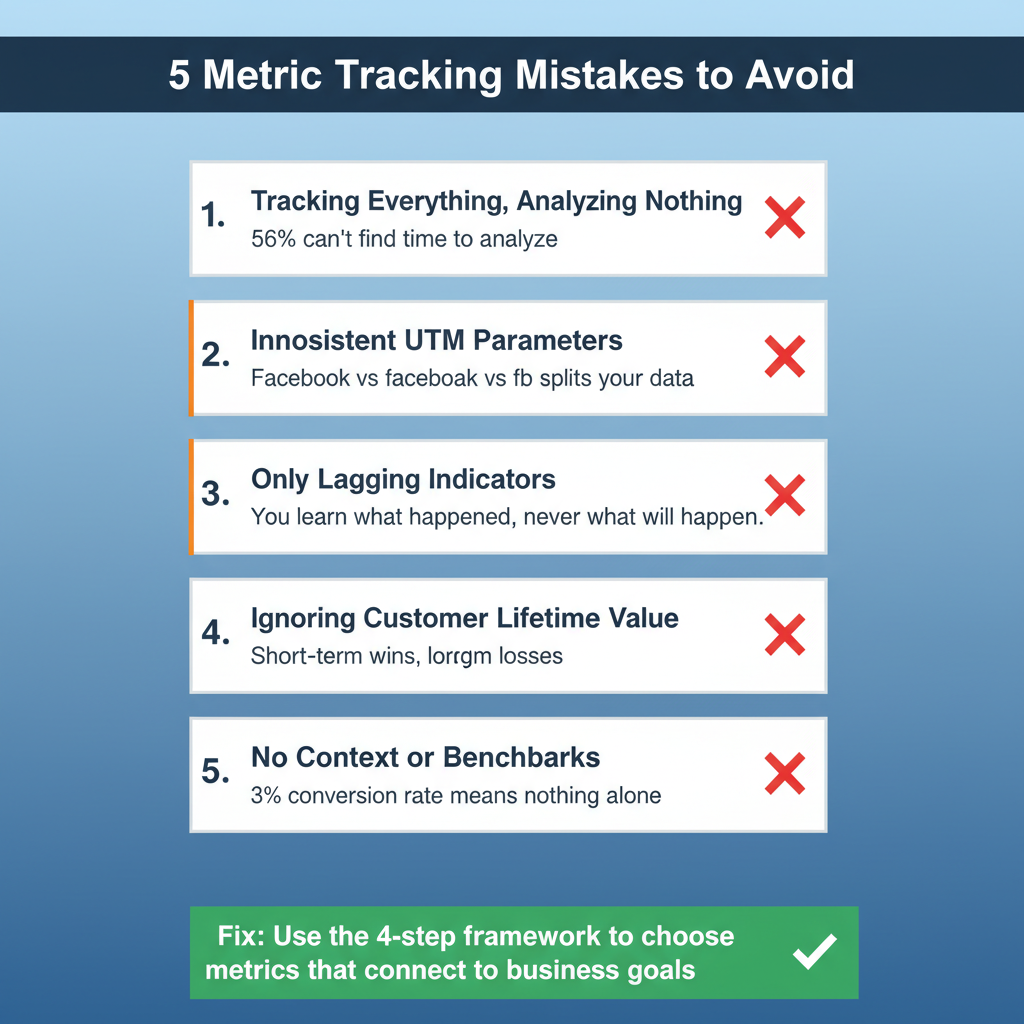
What Are the 5 Biggest Metric Tracking Mistakes?
Even with the right framework, these common mistakes undermine your measurement:
Tracking everything and analyzing nothing. When 56% of marketers can’t find time to analyze their data effectively (Supermetrics, 2025), the problem isn’t a lack of data. It’s too much data with no prioritization.
Using inconsistent UTM parameters. Tagging links as “Facebook,” “facebook,” and “fb” fragments your data into three separate sources. One naming convention, enforced consistently, eliminates this problem entirely.
Focusing only on lagging indicators. Revenue and CAC tell you what happened last quarter. Without leading indicators like CTR and MQL volume, you can’t course-correct before it’s too late.
Ignoring customer lifetime value. Optimizing for short-term conversions while ignoring CLV is like celebrating a first date while the customer quietly leaves after one purchase.
Reporting metrics without context or benchmarks. A 3% conversion rate means nothing in isolation. Compare it to last month, last year, and industry benchmarks. Context turns numbers into insights.
How Does UTM Tracking Improve Marketing Measurement?
UTM parameters connect marketing activity to business outcomes by tagging every link with source, medium, and campaign data. As marketing measurement metrics, they are the invisible thread that ties a social media click to a demo signup to a closed deal.
Without consistent tracking, even the right metrics give you wrong answers. If your attribution data is fragmented, your CAC calculation is off, your channel comparison is inaccurate, and your ROI numbers can’t be trusted.
Organizations implementing comprehensive marketing attribution models see 37% higher marketing ROI (Keo Marketing, 2026). That improvement comes from knowing which marketing touchpoints actually contributed to each conversion.
The shift matters more than ever in 2026. 56% of marketers say privacy rules have made attribution harder, and cookie deprecation will impact 78% of existing attribution setups (Direct Agents, 2025). First-party tracking through UTM parameters isn’t affected by cookie changes, making it the most reliable attribution foundation available.
Ready to build accurate campaign tracking? Start with the UTM link builder to create consistently tagged links for every campaign.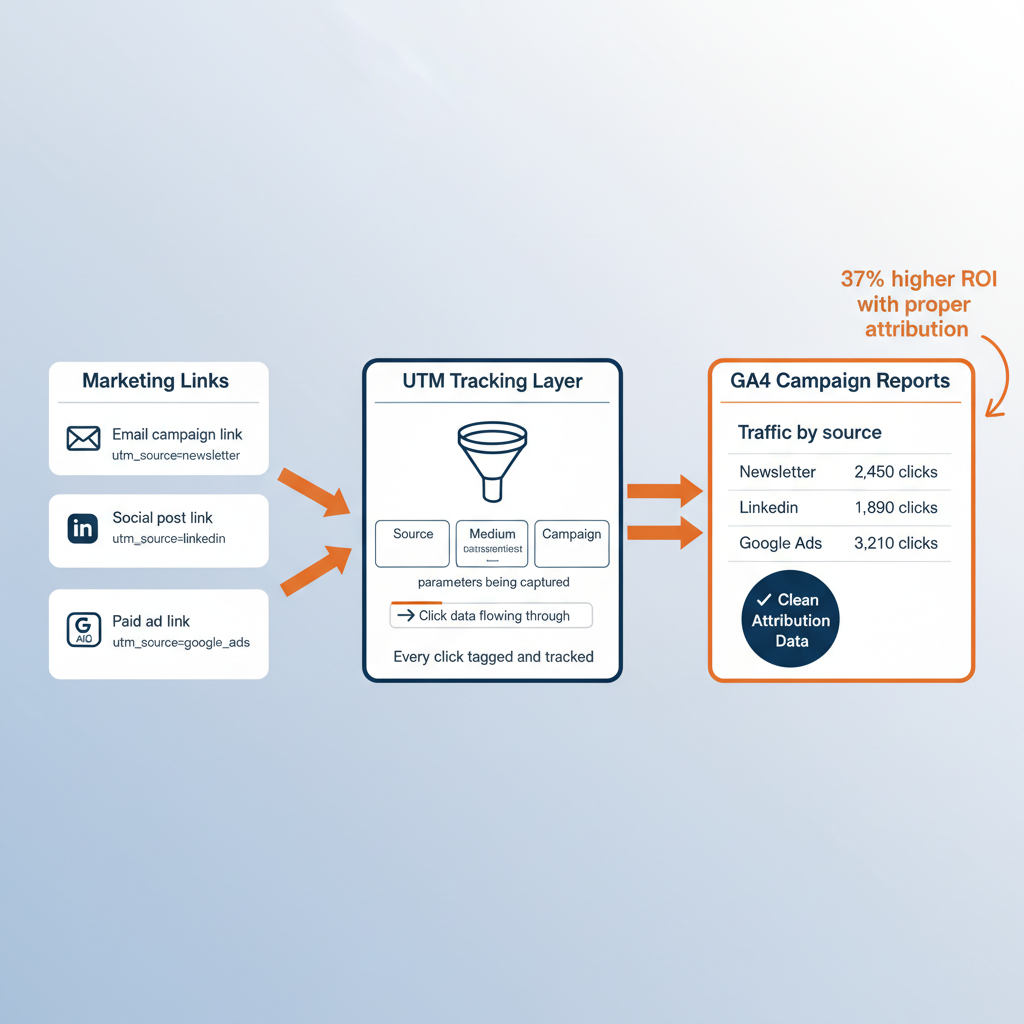
Start Choosing the Right Marketing Metrics Today
The framework is simple: start with business goals, map metrics to the customer journey, limit to 3-5 core KPIs per objective, and ensure every metric is trackable and actionable.
Data-driven companies are 6x more likely to be profitable year-over-year (Marketing LTB, 2025). But data-driven doesn’t mean data-overwhelmed. It means choosing the right marketing metrics to track and building the tracking infrastructure to measure them accurately.
Every metric on your dashboard is only as good as the data feeding it. Clean, consistent campaign tracking through UTM parameters is the foundation that makes every other metric trustworthy.
Start today:
- Audit your current dashboard against the 4-step framework
- Cut anything that doesn’t connect to a business goal
- Set up consistent UTM naming conventions for your team
- Build a reporting cadence that matches your metric types
The marketers who win aren’t the ones tracking the most metrics. They’re the ones tracking the right ones.
FAQ: How to Choose Marketing Metrics
What are the most important marketing metrics to track?
The most important marketing metrics are ROI, Customer Acquisition Cost (CAC), Customer Lifetime Value (CLV), conversion rate, and click-through rate (CTR). The right metrics depend on your business goals, but these five connect directly to revenue and appear across every marketing channel.
How many marketing metrics should I track?
Track 3-5 core KPIs per business objective. Research shows that when teams monitor more than 30 metrics simultaneously, reported clarity on priorities drops by 38%. Focus on a small set of actionable KPIs and treat everything else as supporting data.
What is the difference between a marketing metric and a KPI?
A marketing metric is any quantifiable data point about marketing performance, while a KPI is a metric that directly measures progress toward a specific business goal. All KPIs are metrics, but not all metrics are KPIs. For example, “page views” is a metric, while “organic traffic conversion rate” tied to a revenue target is a KPI.
What are vanity metrics and how do I avoid them?
Vanity metrics are data points that look impressive but do not inform decisions or predict revenue, such as raw follower counts and total page views. Apply this test: if the number changed by 20%, would you change your strategy? If the answer is no, it is a vanity metric and should not be a primary KPI.
How often should I review marketing metrics?
Review campaign-level metrics like CTR and conversion rate weekly, channel-level KPIs like CPL and MQL volume monthly, and strategic metrics like ROI, CAC, and CLV quarterly. This cadence balances real-time optimization with meaningful trend analysis.
How do I choose metrics that align with business goals?
Start by asking what the business needs marketing to improve — revenue growth, customer retention, or market expansion — then select 3-5 metrics that directly measure progress toward that outcome. 64% of marketing leaders cite connecting metrics to financial outcomes as their top challenge.
What tools do I need to track marketing metrics?
At minimum, you need Google Analytics 4 for web analytics, a UTM link management platform like linkutm for consistent campaign tracking, and a marketing automation tool for lead journey data. The most important requirement is consistent UTM parameter usage across all campaigns.
How do UTM parameters help with marketing measurement?
UTM parameters are tags added to marketing links that tell analytics platforms exactly which source, medium, and campaign generated each click and conversion. They are the foundation of accurate marketing attribution. Organizations with comprehensive attribution models see 37% higher marketing ROI.
What is dashboard fatigue and how do I fix it?
Dashboard fatigue occurs when marketers are overwhelmed by too many metrics, causing a loss of focus on priorities. Studies show that monitoring 30+ metrics reduces clarity by 38%. Fix it by limiting dashboards to 3-5 KPIs per business objective and moving all other data to on-demand detail reports.
What is the difference between leading and lagging indicators?
Leading indicators predict future performance (e. g., click-through rate, MQL volume, pipeline velocity), while lagging indicators report outcomes that already happened (e. g., revenue, CAC, quarterly ROI). Track both: use leading indicators for real-time optimization and lagging indicators for strategic reporting.