Here’s a frustrating truth: 83% of marketers say proving ROI is their biggest challenge. Not creating campaigns. Not driving traffic. Proving that their work actually generates revenue.
The problem isn’t a lack of data. It’s tracking the wrong metrics.
Impressions, followers, and page views feel good in reports. But they don’t answer the only question that matters: Is your marketing making money?
This guide covers the 12 essential digital marketing ROI metrics that connect your campaigns to business results. You’ll learn the formulas, see real calculation examples, and understand which metrics matter most for each channel. No more vanity metrics. Just the KPIs that prove your marketing works.
What Are Digital Marketing ROI Metrics?
Digital marketing ROI metrics are measurements that directly connect marketing activities to business revenue. Unlike vanity metrics such as likes or impressions, ROI metrics answer specific questions: How much did we spend? What revenue did we generate? Is our customer acquisition profitable?
The distinction matters. A campaign with 10 million impressions sounds impressive until you realize it generated zero sales. A campaign with 1,000 clicks that produced $50,000 in revenue tells a completely different story.
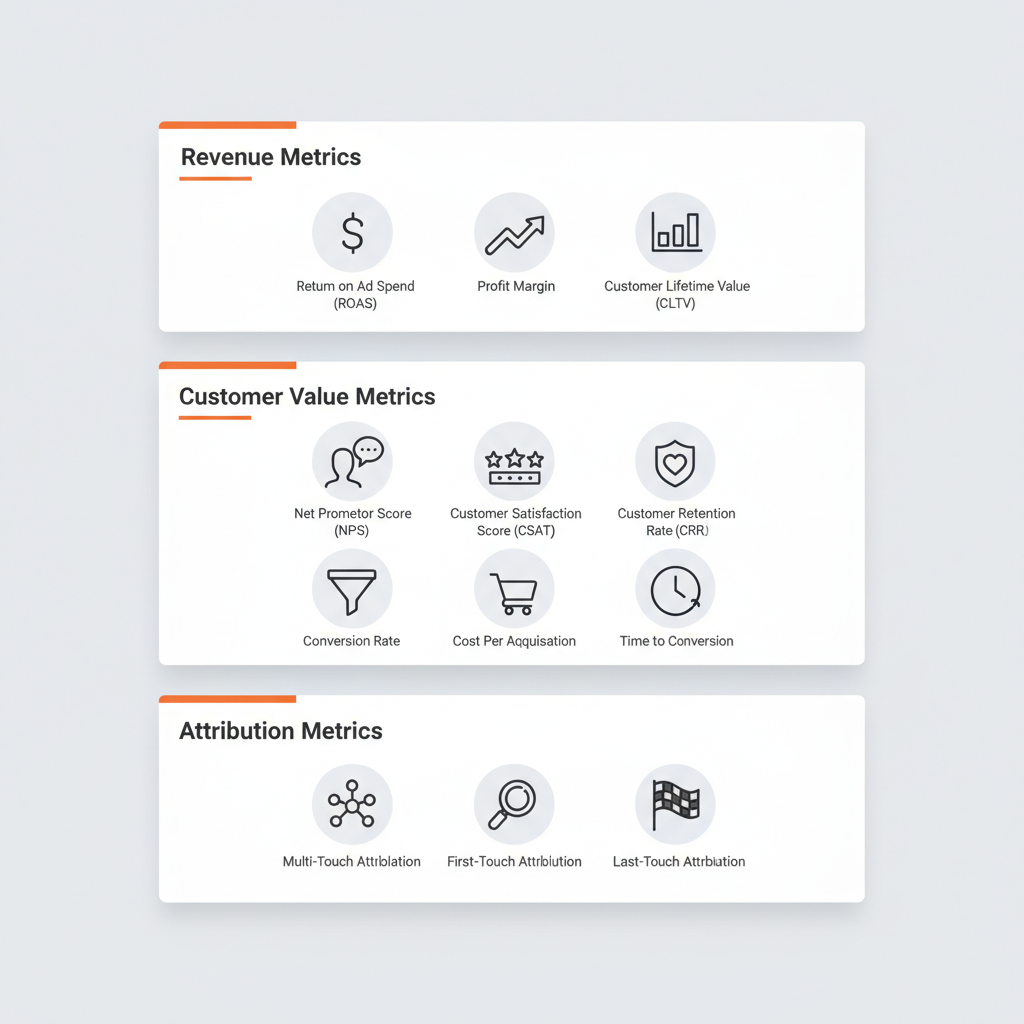
ROI metrics fall into four categories:
- Revenue metrics measure money earned relative to money spent
- Customer value metrics quantify long-term customer worth
- Conversion metrics track actions that lead to revenue
- Attribution metrics ensure data accuracy across channels
Organizations that track these performance metrics are 2.3x more likely to exceed revenue goals. That’s not correlation. That’s causation. When you measure what matters, you optimize what matters.
The 12 Essential Digital Marketing ROI Metrics
Revenue Metrics: Proving Bottom-Line Impact
What is Marketing ROI?
Marketing ROI is the net profit generated from marketing activities expressed as a percentage of marketing costs. It answers the fundamental question: For every dollar spent on marketing, how much profit did we earn?
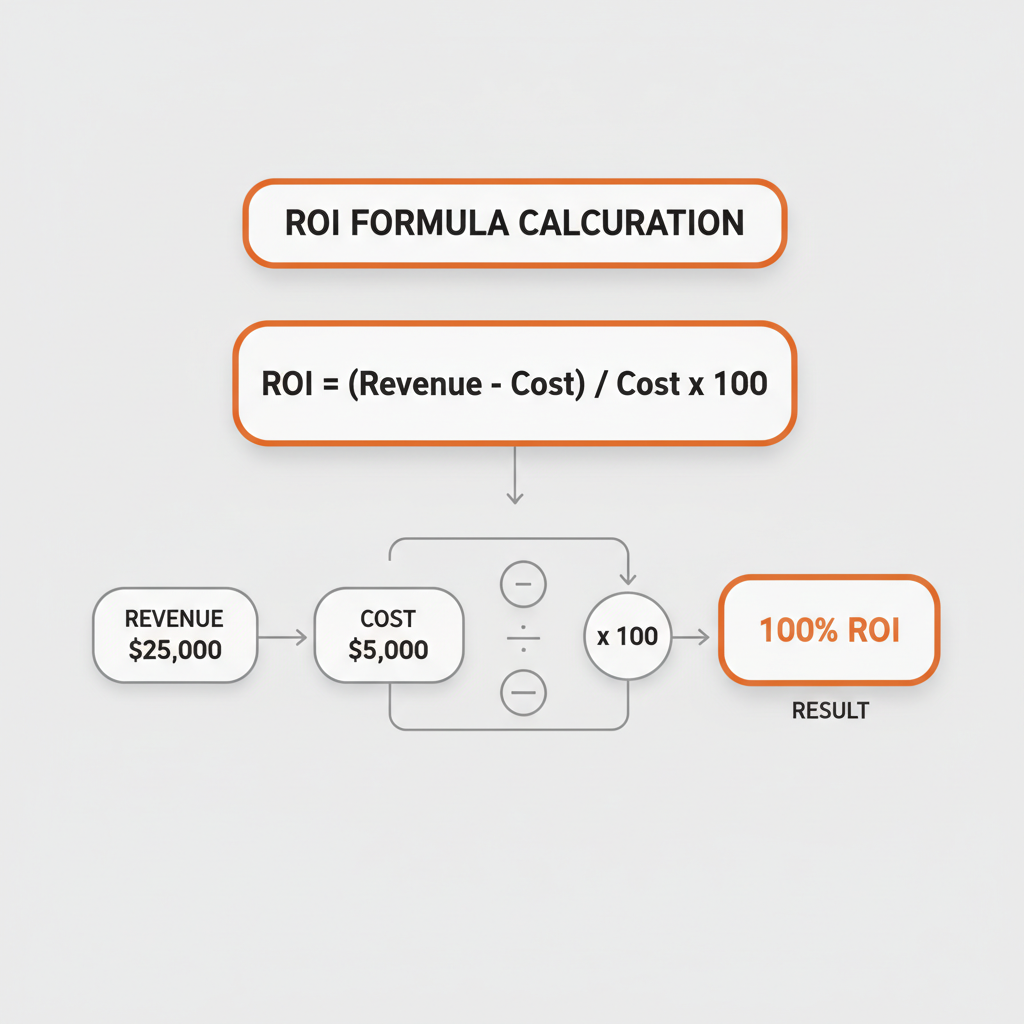
ROI Formula:
ROI = ((Revenue – Marketing Cost) / Marketing Cost) x 100
Example Calculation:
Your email campaign costs $5,000 to execute. It generates $25,000 in attributed revenue with a 40% profit margin ($10,000 net profit).
ROI = (($10,000 – $5,000) / $5,000) x 100 = 100%
A 100% ROI means you doubled your investment. For every $1 spent, you earned $1 in profit.
What’s a good marketing ROI?
A 5:1 ratio (500% ROI) is considered strong across most industries. A 3:1 to 5:1 range indicates healthy marketing efficiency. Below 2:1 signals inefficiency. Above 10:1 may indicate you’re under-investing in growth opportunities.
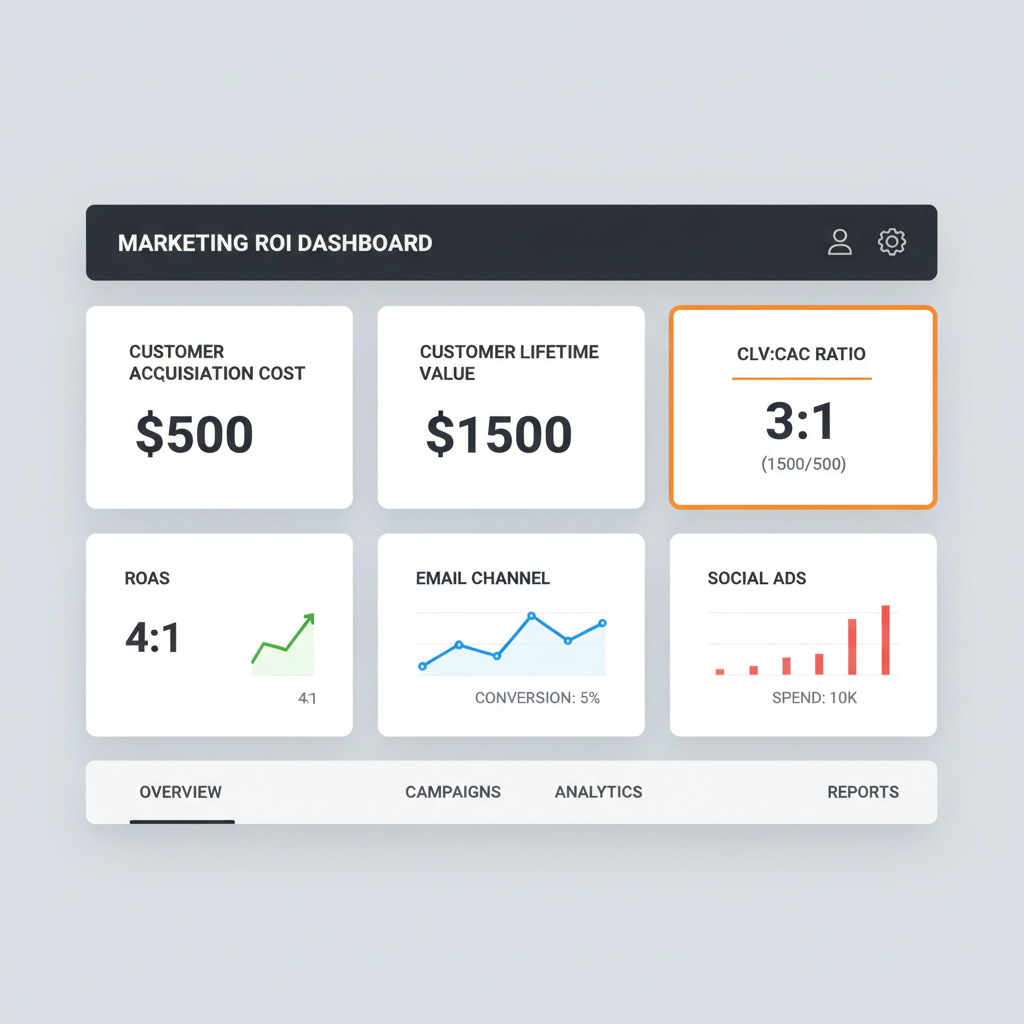
What is Return on Ad Spend (ROAS)?
Return on Ad Spend (ROAS) is the gross revenue generated for every dollar spent on advertising. Unlike ROI, ROAS measures revenue rather than profit and focuses specifically on ad costs rather than total marketing investment.
ROAS Formula:
ROAS = Revenue from Ads / Ad Spend
Example Calculation:
Your Google Ads campaign costs $2,000. It drives $8,000 in tracked revenue.
ROAS = $8,000 / $2,000 = 4:1 (or 400%)
A 4:1 ROAS means you generated $4 in revenue for every $1 spent on ads.
When to use ROAS vs. ROI:
Use ROAS for evaluating specific ad campaigns where you need quick performance feedback. Use ROI for measuring overall marketing efficiency including labor, tools, and overhead costs.
| Aspect | ROI | ROAS |
|---|---|---|
| Measures | Net profit | Gross revenue |
| Formula | (Revenue – Cost) / Cost x 100 | Revenue / Ad Spend |
| Includes | All costs (overhead, labor, tools) | Only advertising spend |
| Best for | Overall marketing efficiency | Campaign-level performance |
| Target benchmark | 5:1 or 500% | 4:1 or 400% |
What is Marketing Efficiency Ratio (MER)?
Marketing Efficiency Ratio (MER) measures total business revenue relative to total marketing spend. It provides a holistic view of marketing’s contribution to revenue that isn’t affected by attribution model limitations.
MER Formula:
MER = Total Revenue / Total Marketing Spend
Example Calculation:
Your business generated $500,000 in revenue last quarter. Total marketing spend was $50,000.
MER = $500,000 / $50,000 = 10:1
A 10:1 MER means you generate $10 in revenue for every $1 invested in marketing.
MER is particularly valuable when multi-touch attribution becomes unreliable. It captures the full impact of brand building and awareness campaigns that don’t get direct attribution credit.
Customer Value Metrics: Understanding Long-Term Worth
How Do You Calculate Customer Acquisition Cost (CAC)?
Customer Acquisition Cost (CAC) is the total cost of acquiring one new customer, including all marketing and sales expenses. CAC reveals whether your customer acquisition is sustainable and profitable.
CAC Formula:
CAC = Total Marketing & Sales Cost / Number of New Customers
Example Calculation:
Last month you spent $15,000 on marketing and $10,000 on sales. You acquired 50 new customers.
CAC = ($15,000 + $10,000) / 50 = $500
Your CAC is $500 per customer.
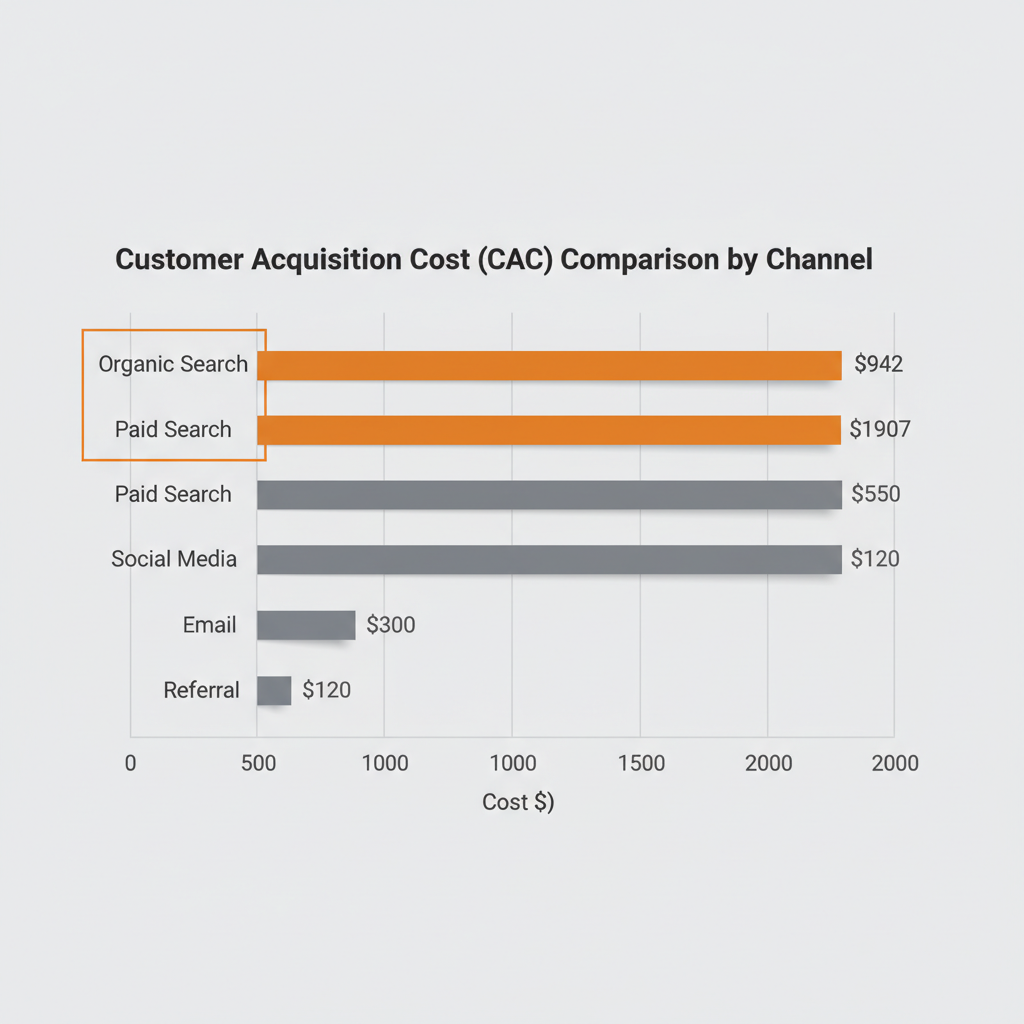
Industry benchmarks:
- B2B organic CAC: $942 average
- B2B paid CAC: $1,907 average
- SaaS companies: $200-$500 typical range
- E-commerce: $10-$50 typical range
A healthy CAC is significantly lower than customer lifetime value. If you’re spending more to acquire customers than they’re worth, you’re losing money on every sale.
How Do You Calculate Customer Lifetime Value (CLV)?
Customer Lifetime Value (CLV) is the total revenue a customer generates during their entire relationship with your business. CLV transforms one-time transaction thinking into long-term relationship thinking.
CLV Formula:
CLV = Average Purchase Value x Purchase Frequency x Customer Lifespan
Example Calculation:
Your average customer spends $100 per purchase, buys 3 times per year, and remains a customer for 4 years.
CLV = $100 x 3 x 4 = $1,200
Each customer is worth $1,200 over their lifetime.
Advanced CLV formula (with margin):
CLV = (Average Purchase Value x Purchase Frequency x Customer Lifespan) x Profit Margin
Using the same example with a 40% profit margin:
CLV = $1,200 x 0.40 = $480 in lifetime profit
CLV is arguably the most important marketing metric because it shifts focus from acquisition cost to customer value creation.
What is a Good CLV: CAC Ratio?
The CLV: CAC ratio compares customer lifetime value to customer acquisition cost. It reveals whether your customer acquisition is generating positive returns over time.
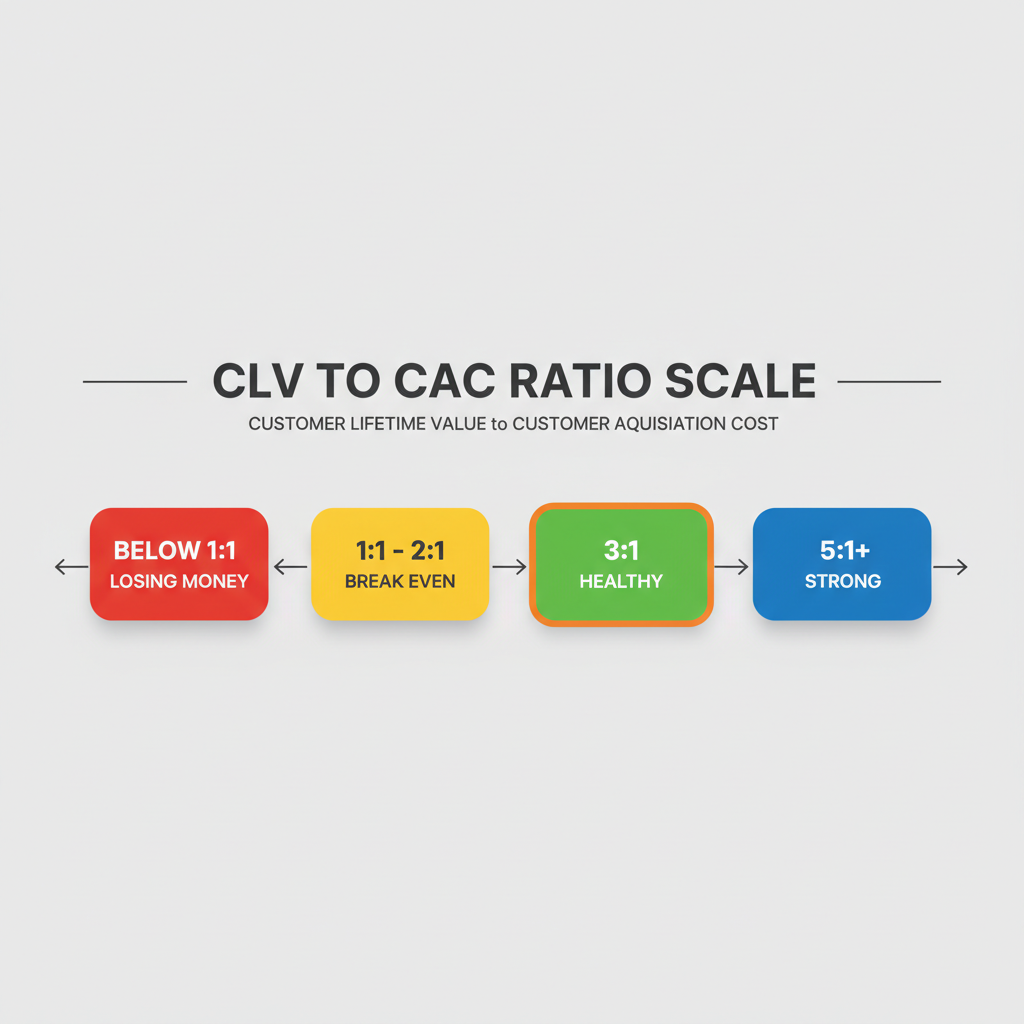
CLV: CAC Ratio Interpretation:
| Ratio | Meaning | Action |
|---|---|---|
| Below 1:1 | Losing money on each customer | Reduce CAC or increase CLV urgently |
| 1:1 to 2:1 | Breaking even or marginal profit | Optimize both acquisition and retention |
| 3:1 | Healthy and sustainable | Maintain current strategy |
| Above 5:1 | Strong efficiency | Consider increasing acquisition investment |
A 3:1 ratio is the standard benchmark for healthy businesses. This means customer lifetime value is three times what you spent to acquire them.
If your ratio exceeds 5:1, you may actually be under-investing in growth. You have profitable customers but aren’t acquiring enough of them.
Conversion Metrics: Tracking Action
What is Conversion Rate in Marketing?
Conversion rate is the percentage of visitors who complete a desired action. The “conversion” can be any goal: a purchase, lead form submission, signup, or download.
Conversion Rate Formula:
Conversion Rate = (Conversions / Total Visitors) x 100
Example Calculation:
Your landing page received 2,000 visitors. 80 visitors submitted your lead form.
Conversion Rate = (80 / 2,000) x 100 = 4%
Conversion rate benchmarks by channel:
| Channel | Average Conversion Rate |
|---|---|
| Organic search | 2.4% |
| Paid search | 2.9% |
| Email marketing | 3.2% |
| Social media | 1.3% |
| Direct traffic | 2.2% |
| B2B landing pages | 2.2% |
| E-commerce | 1.8% |
A “good” conversion rate depends entirely on your industry, traffic source, and conversion goal. Always benchmark against your own historical performance first.
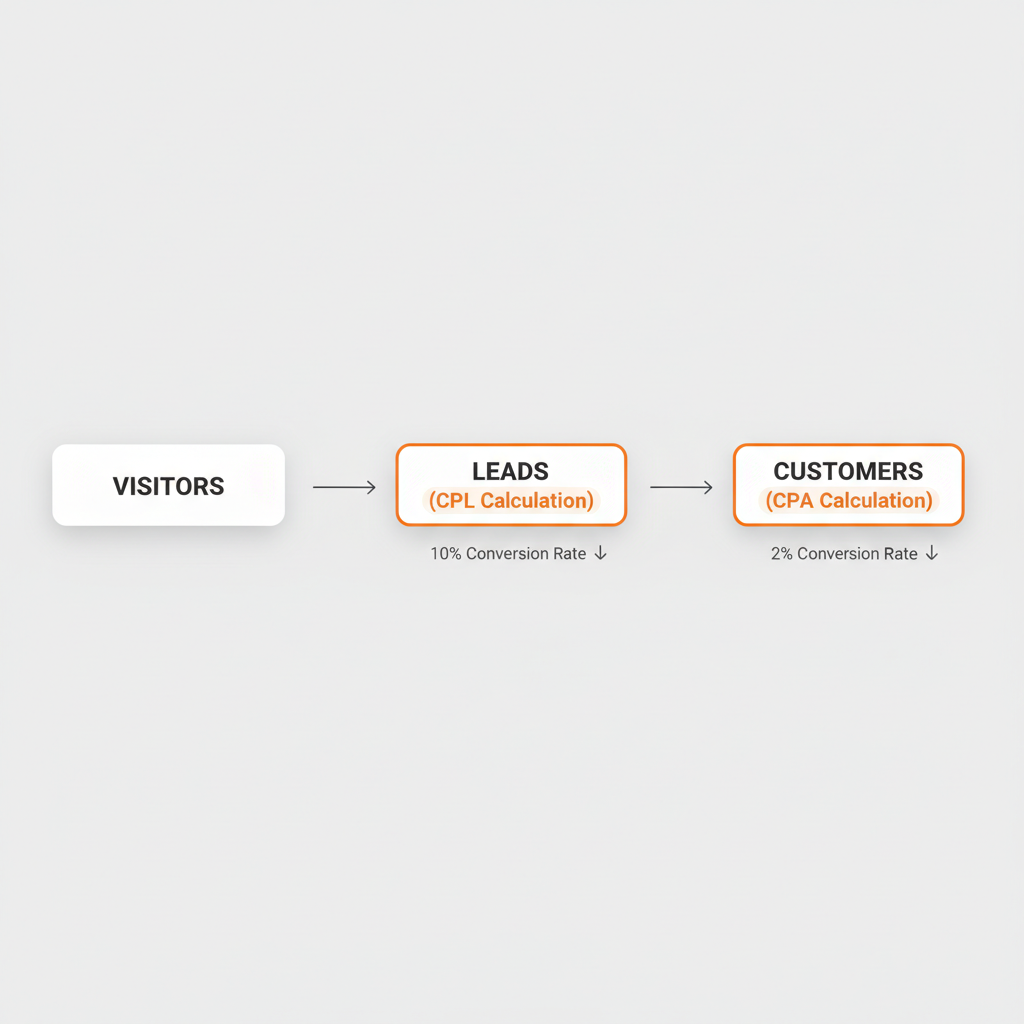
How Do You Calculate Cost Per Lead?
Cost Per Lead (CPL) measures how much you spend to generate one marketing qualified lead. CPL helps evaluate the efficiency of top-of-funnel activities.
CPL Formula:
CPL = Total Marketing Spend / Number of Leads
Example Calculation:
Your content marketing budget is $8,000 per month. You generate 160 leads from gated content downloads.
CPL = $8,000 / 160 = $50
Each lead costs $50 to acquire.
B2B CPL benchmarks:
- Organic leads: $942 average
- Paid leads: $1,907 average
- Technology sector: $208 average
- Healthcare: $286 average
CPL varies dramatically by industry and lead quality. A $50 lead that converts at 20% is more valuable than a $20 lead that converts at 2%.
What is Cost Per Acquisition (CPA)?
Cost Per Acquisition (CPA) measures the cost to acquire one paying customer or one completed conversion. While CPL tracks leads, CPA tracks actual business outcomes.
CPA Formula:
CPA = Total Cost / Number of Conversions
Example Calculation:
Your paid social campaign spent $3,000 and generated 30 product purchases.
CPA = $3,000 / 30 = $100
Each customer acquisition costs $100.
CPA vs. CPL:
- CPL measures cost per marketing qualified lead
- CPA measures cost per paying customer or completed action
- A business might have a $50 CPL but $500 CPA if only 10% of leads convert to customers
CPA is often more actionable than CPL because it measures actual revenue-generating events rather than potential customers.
Engagement & Attribution Metrics
Why Does Click-Through Rate Matter for ROI?
Click-through rate (CTR) is the percentage of people who click your link after seeing it. CTR directly impacts ROI because higher CTR means more traffic from the same impressions, lowering your effective cost per visitor.
CTR Formula:
CTR = (Clicks / Impressions) x 100
Example Calculation:
Your email campaign was opened by 5,000 recipients. 250 clicked your CTA link.
CTR = (250 / 5,000) x 100 = 5%
CTR benchmarks by channel:
| Channel | Average CTR |
|---|---|
| Google search ads | 3.17% |
| Display ads | 0.46% |
| Facebook ads | 0.90% |
| Email marketing | 2.5% – 3% |
| Organic search (position 1) | 27.6% |
| Organic search (position 10) | 2.4% |
Improving CTR amplifies every other metric. A 50% CTR improvement means 50% more visitors at the same cost, dramatically impacting downstream conversions and ROI.
For a deeper understanding of CTR optimization, see our guide on what click-through rate is and why it matters.
What is Attribution Accuracy?
Attribution accuracy measures the quality and completeness of your tracking data. Without accurate attribution, every other ROI metric becomes unreliable.
Studies show 15-25% of conversions have incomplete attribution, often called “dark social.” This means one in five conversions may be misattributed or unattributed entirely.
Signs of poor attribution accuracy:
- Large “Direct” traffic segment in analytics
- Revenue that can’t be traced to specific campaigns
- Inconsistent UTM parameters across channels
- Last-click attribution hiding multi-touch journeys
Improving attribution accuracy:
- Implement consistent UTM parameters on all campaign links
- Use a link management tool to enforce naming conventions
- Configure multi-touch attribution in Google Analytics 4
- Track micro-conversions throughout the customer journey
Attribution is the foundation of ROI measurement. If you can’t trust your attribution, you can’t trust your metrics.
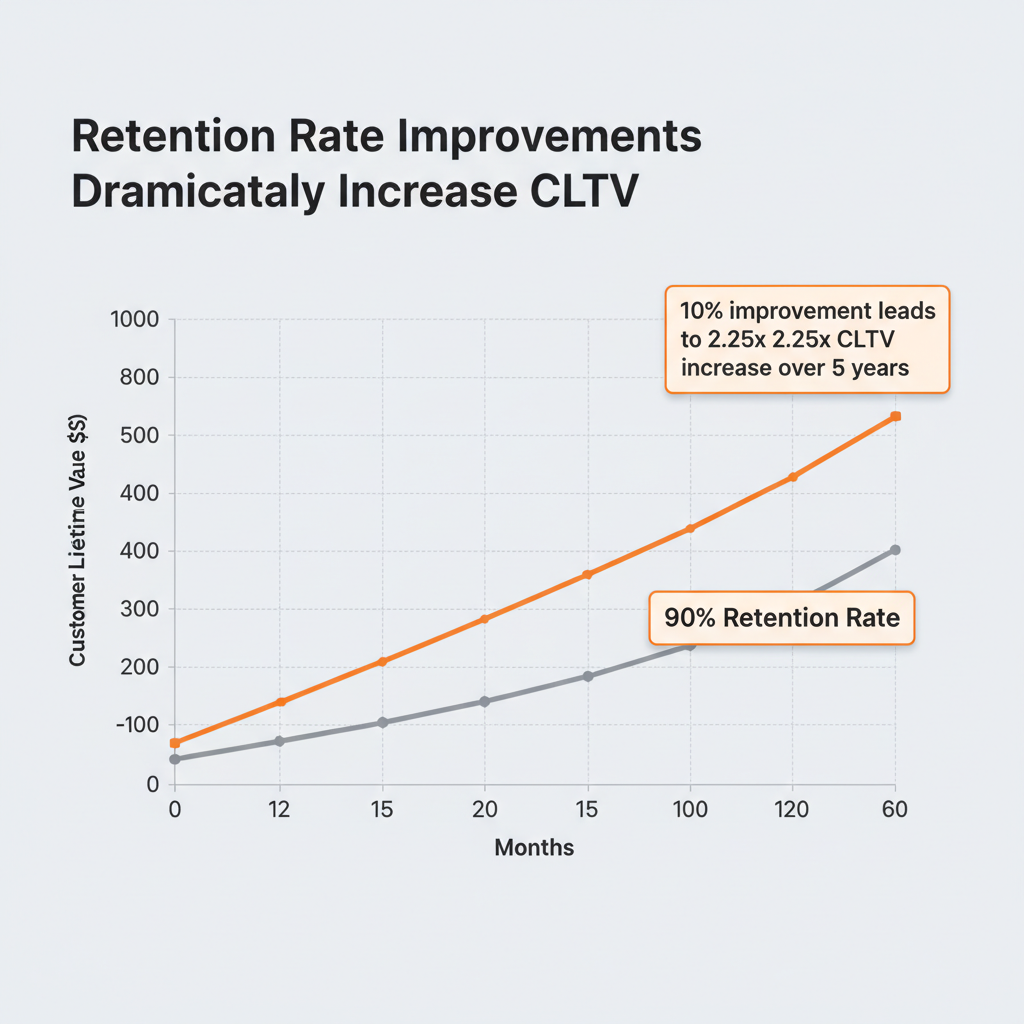
How Do You Calculate Customer Retention Rate?
Customer retention rate measures the percentage of customers you keep over a specific period. Retention directly impacts CLV and overall marketing efficiency.
Retention Rate Formula:
Retention Rate = ((End Customers – New Customers) / Start Customers) x 100
Example Calculation:
You started the quarter with 1,000 customers. You acquired 200 new customers. You ended with 1,050 customers.
Retention Rate = ((1,050 – 200) / 1,000) x 100 = 85%
You retained 85% of your existing customers.
Why retention matters for ROI:
- Acquiring new customers costs 5-25x more than retaining existing ones
- A 5% increase in retention can increase profits by 25-95%
- Retained customers have higher CLV due to repeat purchases
High retention amplifies the value of every acquisition, making your CAC investment more efficient over time.
Which Metrics Matter Most by Marketing Channel?
Different channels require different measurement approaches. Here’s which digital marketing ROI metrics to prioritize by channel:
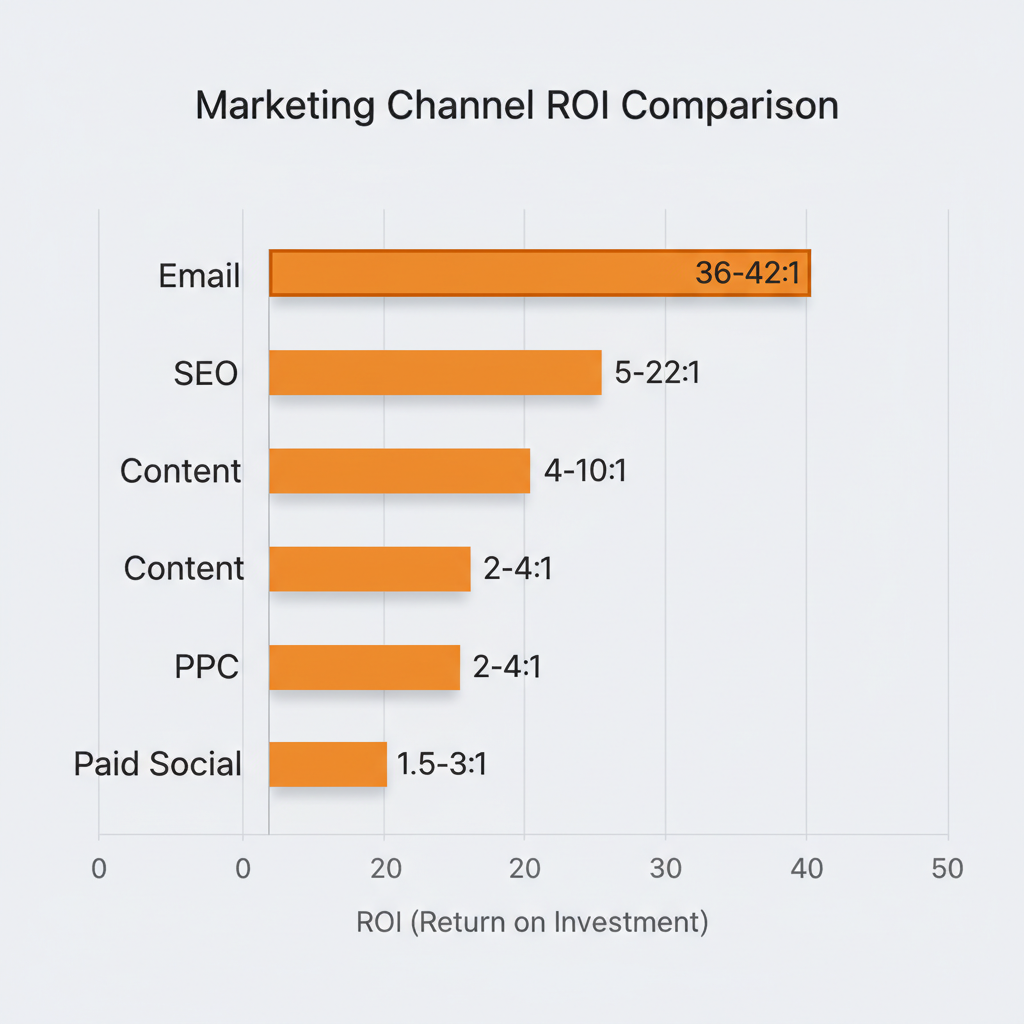
| Channel | Primary Metrics | Secondary Metrics | Benchmark ROI |
|---|---|---|---|
| Email Marketing | ROI, CTR, Conversion Rate | Open Rate, Unsubscribe Rate | 36:1 to 42:1 |
| SEO | Organic Revenue, CPL, CAC | Rankings, Organic Traffic | 5:1 to 22:1 |
| PPC / Google Ads | ROAS, CPA, Conversion Rate | CTR, Quality Score | 2:1 to 4:1 |
| Paid Social | ROAS, CPA, Attribution | Reach, Engagement | 1.5:1 to 3:1 |
| Content Marketing | CLV, CPL, Time-to-Convert | Traffic, Dwell Time | 4:1 to 10:1 |
Email marketing delivers the highest ROI (36:1 to 42:1) when list quality is strong. Focus on CTR and conversion rate to maximize returns. Learn how to track email campaigns with UTM parameters for accurate attribution.
SEO compounds over time with 5:1 to 22:1 returns. Measure organic revenue and CPL rather than just rankings. Traffic without conversions isn’t valuable.
PPC provides faster results but requires ongoing spend. ROAS and CPA tell you whether campaigns are profitable. A 4:1 ROAS is typically healthy for most industries.
Content marketing requires patience but builds lasting assets. Focus on CLV and time-to-convert since content often influences purchases weeks or months later.
How Do You Track Marketing ROI Accurately?
Accurate ROI measurement depends on accurate tracking. Here’s how to build a reliable measurement foundation:
Step 1: Implement Consistent UTM Parameters
UTM parameters tag your marketing links with source, medium, and campaign information. This data flows directly into Google Analytics 4, enabling precise attribution.
Every campaign link should include:
utm_source: Traffic origin (newsletter, facebook, google)utm_medium: Marketing channel (email, cpc, social)utm_campaign: Specific campaign name (spring_sale, product_launch)
Inconsistent UTM naming fragments your data. “Facebook” and “facebook” appear as separate sources. Use a consistent naming convention and enforce it with a UTM builder tool.
Step 2: Configure Multi-Touch Attribution
Last-click attribution only credits the final touchpoint before conversion. This ignores the awareness and consideration activities that influenced the purchase.
Multi-touch attribution models distribute credit across touchpoints:
- Linear: Equal credit to all touchpoints
- Time decay: More credit to recent touchpoints
- Position-based: 40% to first touch, 40% to last touch, 20% distributed to middle
Google Analytics 4 includes data-driven attribution that uses machine learning to assign credit based on actual conversion patterns.
Step 3: Connect Revenue to Campaigns
Import conversion values into your analytics platform. For e-commerce, this means tracking actual transaction amounts. For B2B, assign values to lead stages based on historical conversion rates.
Example: If leads convert to customers at 10% with $5,000 average deal value, each lead is worth $500 in expected value.
Step 4: Account for Full Marketing Costs
ROI requires knowing true costs. Include:
- Media spend (ads, sponsorships)
- Tool and platform costs
- Agency and contractor fees
- Internal labor costs
- Content creation expenses
Many marketers undercount costs, inflating apparent ROI. Be honest about what marketing actually costs.
Common ROI Tracking Mistakes to Avoid
Even experienced marketers make these errors when measuring digital marketing ROI:
1. Tracking vanity metrics instead of revenue metrics
Followers, likes, and impressions feel good but don’t pay bills. Always tie metrics back to revenue impact. A campaign that generates 1 million impressions and zero sales has zero ROI.
2. Inconsistent UTM parameters fragmenting data
When team members use different naming conventions, analytics data splinters across dozens of sources. Establish documented standards and use a link management platform to enforce them. Check out our UTM best practices guide for naming conventions that work.
3. Ignoring customer lifetime value
Measuring only first-purchase revenue undervalues customer relationships. A customer with $100 first purchase and $1,200 lifetime value requires different acquisition math than single-transaction analysis suggests.
4. Relying on last-click attribution
Last-click gives 100% credit to the final touchpoint, ignoring all preceding interactions. Email might get credit for a sale that started with a blog post, continued through social media, and required three email touches. Multi-touch attribution reveals the full picture.
5. Not calculating true marketing costs
Forgetting to include labor, tools, and overhead inflates ROI. If your “free” content marketing requires 40 hours of staff time monthly, that has a real cost.
6. Measuring too infrequently
Monthly reviews miss optimization opportunities. Check campaign-level metrics weekly. Review strategic metrics monthly. Deep-dive quarterly.
7. Comparing incompatible timeframes
SEO delivers ROI over months; paid ads deliver within days. Comparing Q1 SEO spend to Q1 SEO revenue misses the lag. Match measurement windows to channel characteristics.
Tools for Tracking Digital Marketing ROI Metrics
Google Analytics 4
GA4 is the foundation for digital marketing attribution. Configure it to track:
- Conversion events with values
- Campaign parameters from UTM links
- User journeys across sessions
- Revenue attribution by source/medium
GA4’s data-driven attribution model automatically calculates multi-touch credit based on your actual conversion patterns.
UTM Link Management
Consistent UTM tracking requires a systematic approach. linkutm provides:
- UTM builder with automatic naming enforcement
- Bulk link creation for large campaigns
- Team workspaces with shared conventions
- GA4 integration for seamless data flow
Manual UTM creation in spreadsheets leads to errors. Automation ensures consistency.
Marketing Automation Platforms
Platforms like HubSpot, Marketo, and Mailchimp track email and nurture campaign performance. They provide engagement metrics that feed into overall ROI calculation.
BI and Reporting Tools
Tools like Looker, Tableau, or Google Data Studio consolidate metrics from multiple sources into unified ROI dashboards. This enables apples-to-apples comparison across channels.
Start Measuring What Matters
Digital marketing without ROI measurement is guesswork. You might get lucky, but you can’t optimize what you don’t measure.
Start with these three steps:
- Choose your core metrics: Pick 3-5 metrics from this guide that align with your business goals. Don’t try to track everything.
- Fix your attribution foundation: Implement consistent UTM tracking on every campaign link. Bad data leads to bad decisions.
- Calculate your baselines: Determine current CAC, CLV, and channel ROI. You need starting points to measure improvement.
Data-driven organizations are 6% more profitable than competitors. That edge compounds over time. The sooner you start measuring correctly, the faster you pull ahead.
Ready to build accurate marketing attribution? Try linkutm free and start tracking every campaign link with consistent UTM parameters.
—
FAQ: Digital Marketing ROI Metrics
What is the most important digital marketing metric?
Customer Lifetime Value (CLV) is often considered the most important metric because it measures total customer worth over time, not just initial purchase. However, the most important metric depends on your goals. For paid campaigns, focus on ROAS. For overall efficiency, prioritize the CLV: CAC ratio. For growth, track conversion rates and CAC.
How often should I review marketing ROI metrics?
Review campaign-level metrics (CTR, conversion rate, ROAS) weekly to catch issues quickly. Review strategic metrics (CAC, CLV, overall ROI) monthly. Conduct comprehensive analysis of trends, benchmarks, and attribution quarterly. Don’t wait until year-end to discover problems.
What’s the difference between ROI and ROAS?
ROI measures net profit as a percentage of total investment, including all marketing costs. ROAS measures gross revenue per dollar of advertising spend only. Use ROI for evaluating overall marketing efficiency. Use ROAS for comparing specific ad campaign performance.
How do I track ROI across multiple channels?
Implement consistent UTM parameters on all campaign links to attribute conversions in Google Analytics 4. Configure multi-touch attribution to understand how channels work together. Use a link management tool like linkutm to maintain naming consistency across teams and campaigns.
What’s a good CLV: CAC ratio?
A 3:1 CLV: CAC ratio is the standard benchmark for healthy businesses, meaning customer lifetime value is three times acquisition cost. Below 1:1 means losing money on each customer. Between 1:1 and 2:1 requires optimization. Above 5:1 may indicate under-investment in customer acquisition.
How do UTM parameters help with ROI tracking?
UTM parameters tag your marketing links with source, medium, and campaign information that flows directly into analytics platforms. This enables accurate attribution of revenue and conversions to specific campaigns, channels, and content pieces. Without UTM tracking, much of your marketing data ends up as “Direct” traffic with no attribution.
What metrics should I ignore?
Avoid over-indexing on vanity metrics like social media followers, page likes, or raw impressions. These don’t directly correlate with revenue. Focus instead on metrics connected to business outcomes: conversions, revenue, CAC, CLV, and ROI. Track engagement metrics only as leading indicators of revenue metrics.
How do I calculate marketing ROI if I can’t track all conversions?
Use multi-touch attribution models to estimate contribution from channels with incomplete tracking. Implement UTM tracking on all controllable touchpoints. For channels like dark social where direct tracking isn’t possible, use Marketing Efficiency Ratio (MER) to measure overall revenue relative to marketing spend without requiring perfect attribution.